My $200 Claude subscription produced $2,556 of API-priced work in 26 days. That sounds like the story. It was not even the most interesting number.
The interesting number was 95.5 percent: the share of every token that came from cache reads. That is the number that explains why my agentic coding habit feels economically rational while the API-priced meter says it should have been alarming.
Three weeks ago, in The Subsidy and the Severance, I called tokens-consumed a vanity metric. I said the leaderboard era was ending, and good riddance. I compared it to measuring a book by its page count.
Then I ran the leaderboard.
I used ccusage, a local CLI that reads Claude Code session logs and prices every token at API rates. It gave me the number I had sworn off, then made that number useful by showing me what sat underneath it.
So treat this as the confession and the correction. I still believe token leaderboards are a weak way to measure engineering value. But a bad headline metric can become useful when it pushes you into better questions.
What did the work produce? Which model tier did it really need? How much of the economics depended on cache? Could the same workflow survive if the preferred model disappeared?
Those are the questions the meter started asking back.
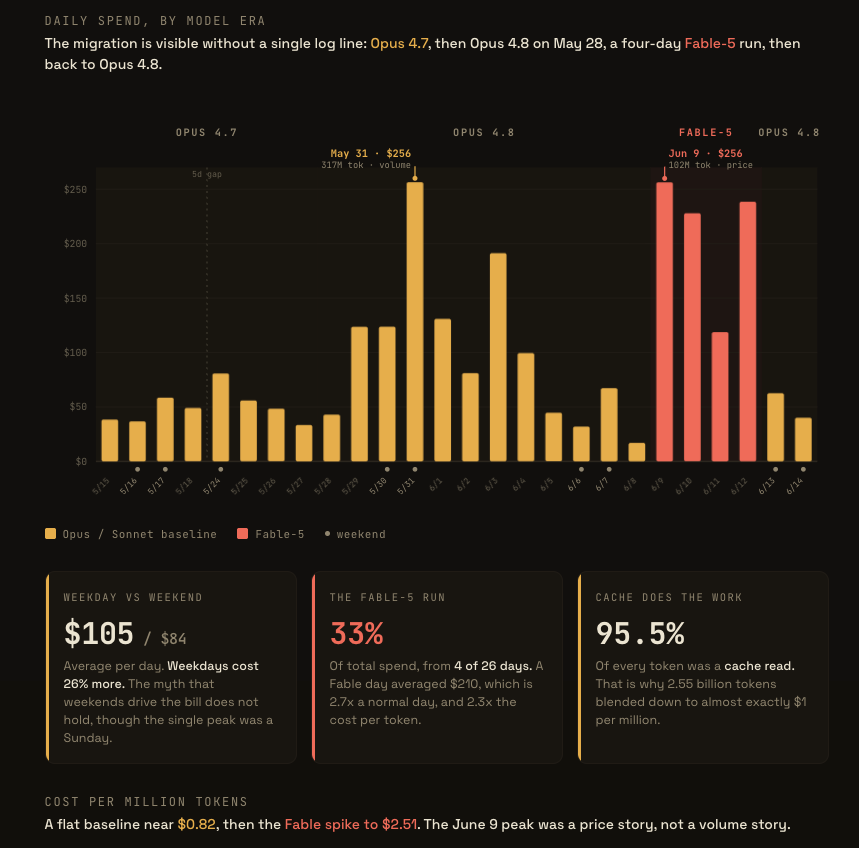
Twenty-six days of Claude Code, priced at API rates. The amber bars are Opus and Sonnet. The coral bars are Fable 5. Watch where the coral stops.
The number I swore off
Here is what ccusage reported: across 26 days, my Claude Code sessions moved 2.55 billion tokens and would have cost $2,556 at API rates.
That number is real, but it is not value. It is counterfactual spend.
It tells me I am a heavy user, which I already knew. It does not tell me whether I shipped better software, produced clearer artifacts, improved verification, or avoided meaningful rework. Those are the numbers that matter, and the meter cannot infer them from token flow.
The useful part of the report was hiding one layer down. Of those 2.55 billion tokens, 95.5 percent were cache reads. That single fact explains how 2.55 billion tokens blended down to almost exactly $1 per million. Agentic coding does not run on raw context alone. At this volume, it runs on reuse.
Take caching away, and the economics change from "interesting" to "please invite finance to the meeting."
So the headline number is a vanity number sitting on top of an operating signal. That gap is the story.
Two thousand five hundred dollars, two hundred paid
ccusage prices my work at API list rates. I do not pay list rates. I pay Anthropic $200 a month for the Max 20x plan.
The $2,556 is not my bill. It is what those 26 days would have cost if I rented the same compute by the token.
Hold the two numbers next to each other. $2,556 of API-priced usage. $200 paid. That is roughly a 13x gap, and it has a name. I have been calling it the subsidy.
The run rate makes it sharper. At about $98 a day, my $200 subscription pays for itself in roughly two days. After that, the economics are less my credit card and more Anthropic's product strategy.
To be fair, a subsidy is not a scandal by itself. Flat-rate pricing is a product strategy. Vendors use it to build habits, learn workflows, smooth adoption, and make a tool feel safe enough for people to use heavily. That is not sinister. It is normal software economics with larger GPUs behind the curtain.
The risk begins when teams build an operating model around that temporary gap and mistake today's adoption pricing for durable unit economics. That is when the subsidy stops being a bargain and starts becoming an architectural assumption.
This is where my own essay turns around and points at me. I am not just the observer of The Subsidy and the Severance. I am the power user burning tokens, the one I said leaders should watch carefully.
The open question from that piece applies to me directly.
Am I the bargain or the bonfire?
ccusage cannot answer that. It can only tell me the meter is running fast. Whether the spend bought value is a different question, and it requires a different ledger.
I was wrong about the weekends
I went in with a hypothesis. I assumed my heavy days were weekends, when the day job steps aside and the side projects take over.
The data disagreed.
My weekday average was $106. My weekend average was $84. Weekdays ran 26 percent hotter. My single biggest day was a Sunday, so the peak was a weekend, but the mass lives Monday through Friday.
That is the quiet, useful function of real measurement. It overrules the story you were about to tell. I would have written the weekend version with total confidence, and I would have been wrong.
That matters because leaders do this all the time with AI. We explain spend with vibes. We blame the obvious workflow, the loudest team, the newest tool, or the use case we already suspected. Then the data shows that the cost lives somewhere else.
The meter does not make the decision for you. It does something almost as useful. It keeps you honest before the narrative hardens.
Same bill, opposite cause
Two days in the set cost almost exactly the same. May 31 cost $256. June 9 cost $256.
Identical bill.
The bills lied about the cause.
May 31 processed 317 million tokens. June 9 processed 102 million. One day cost that much because of volume. The other cost that much because of price.
The price story has a name: Fable 5. For four days in June, I ran Anthropic's new top tier. Anthropic's pricing table listed Fable at $10 per million input tokens and $50 per million output tokens, exactly twice the $5 and $25 for Opus 4.8. My dashboard ran a little hotter than that list ratio. Across my actual usage mix, a Fable day cost 2.3 times a normal day per token, for work that was not always 2.3 times better.
This is where value per token becomes useful, not as a final KPI, but as a diagnostic. Tokens consumed told me both days were a big deal. Cost per token told me one was a volume problem and the other was a pricing decision. Value per outcome would tell me whether either day deserved the spend.
That last distinction matters. The question is not whether the premium model is better. It usually is. The question is whether this task needed the premium model, whether the output survived verification, and whether the workflow would degrade gracefully if that tier disappeared.
Without those questions, premium model routing becomes a very expensive form of optimism.
I am pro-optimism. I am less enthusiastic when it shows up with line-item pricing.
The kill switch is in this chart
Look again at where the coral stops.
The Fable bars end on June 12. The next two days are Opus 4.8. If you did not know better, you would call that discipline. You would assume I stared at four straight days of triple-digit spend and got religion.
That is not what happened.
The chart alone does not prove causation. It only records the red bars ending on a Friday evening. The source explains why. In Anthropic's access update, the company said a U.S. export-control directive forced it to suspend Fable 5 and Mythos 5 for foreign nationals. To comply, it disabled both models for everyone. The directive landed Friday, June 12. By that night Fable was gone, and my next two days ran on Opus 4.8 because nothing else was on the menu.
My usage chart recorded the business-continuity event as cleanly as it recorded spend.
The four-day Fable run cost $841. That is 4.2 times my entire monthly subscription, spent in four days, on one model. Then the model was gone.
That is the subsidy and the severance in a single chart. The expensive tier showed me what metered intelligence really costs. The stop showed me that the meter is not even the scariest variable. The scariest variable is whether the thing you depend on is still there when the work needs to continue.
The metric I actually want
Strip the report down, and the biggest number is not the most important one.
$2,556 is appetite, not value.
95.5 percent cache reads is architecture, not trivia.
The Fable run is routing discipline, or lack of it.
The kill switch is continuity risk, hiding inside what looked like a productivity tool.
The metric that survives all four is not value per token by itself. It is value per verified outcome, with token cost as a diagnostic.
That is a small wording change with a large operational difference. A cheap model that produces unreviewed garbage is not cheap. An expensive model that saves a week of expert rework may be worth it. A workflow that depends on one inaccessible model may be fast right up until it is not.
The outcome has to pass verification, and the workflow has to be portable enough to survive the stop.
That is the AI spend ledger I actually want.
| Question | What it protects you from |
|---|---|
| What verified outcome did this produce? | Confusing activity with value. |
| Which model tier did the work really need? | Premium-model sprawl. |
| What was the cache-read ratio? | Missing the architecture underneath the economics. |
| What did it cost per accepted result? | Optimizing for cheap tokens instead of useful output. |
| Could this run on another model tomorrow? | Treating model access as permanent infrastructure. |
This is not a call to ban premium models or celebrate cheap subscriptions. It is a call to operate AI like something that matters. Use the powerful model when the work deserves it. Use the cheaper model when the work does not. Use the cache when reuse is real. Verify the output either way.
And please do not confuse today's subsidy with tomorrow's business case.
Read your own meter
Here is the corrected confession. I ran the vanity metric, and the vanity metric earned its keep. The dashboard total was theater. The lessons were everywhere else: in the cache ratio, the weekend assumption I got wrong, the twin $256 days with opposite causes, and the gap between $2,556 of API-priced usage and a $200 subscription.
The bottleneck was never the stack. It was not the language, the framework, or the cloud. It is not the token price, even now that the meter is finally visible. It is not even the model, which I learned can vanish between Friday dinner and Saturday coffee.
The real bottleneck is knowing which work is worth funding, which work deserves the expensive tier, and which work can survive when that tier disappears.
That is the AI meter I care about now: value per verified outcome, cost per accepted result, and portability when the stop comes.
I intend to keep reading my own meter. The leaders who are serious about agentic software should probably start reading theirs too.